 Florida
Keys Carrying Capacity Study
Florida
Keys Carrying Capacity Study
Carrying Capacity Analysis/Impact Assessment Model
1.0 Organization of this Report
This document compiles information resulting from the Carrying Capacity Analysis/Impact Assessment Model (CCIAM) scenario analysis. The report is organized in the following manner:
· Background and Legal Mandate of the Florida Keys Carrying Capacity Study
· Carrying Capacity Indicators
· List of Supporting Documentation
2.0 Background and Legal Mandate of the Florida Keys Carrying Capacity Study
In 1986, a new comprehensive plan and corresponding land development regulations were approved for Monroe County. They were developed in response to the Area of Critical State Concern designation, as well as to comply with State of Florida regulations and to maintain a high quality of life in the region. In 1991, the Monroe County Board of Commissioners ratified the Monroe County Year 2010 Comprehensive Plan (the Plan).
The Plan was revised in 1993 following several legal challenges initiated by the DCA and other private organizations. Ongoing legal proceedings prompted a 1995 Final Order and Recommendation by the Hearing Officer, which resulted in further revisions and final adoption of the Plan in 1996. During final revisions of the Plan, a “carrying capacity approach” to growth management was adopted.
The Florida Administrative Code (FAC) issued an Executive Order in 1996 calling for the preparation of a “carrying capacity analysis” for the Florida Keys. The FKCCS fulfills a portion of the state and local government requirements as outlined in Florida Administration Commission Rules. Sections 28-20.100 and 28-19.100 FAC state:
“The [carrying capacity] analysis shall be based upon the findings adopted by the Administration Commission on December 12, 1995, or more recent data that may become available in the course of the study, and shall be based upon the benchmarks of, and all adverse impacts to, the Keys land and water natural systems, in addition to the impacts of nutrients on marine resources. The carrying capacity analysis shall consider aesthetic, socioeconomic (including sustainable tourism), quality of life and community character issues, including the concentration of population, the amount of open space, diversity of habitats, and species richness. The analysis shall reflect the interconnected nature of the Florida Keys’ natural systems, but may consider and analyze the carrying capacity of specific islands or groups of islands and specific ecosystems or habitats, including distinct parts of the Keys’ marine ecosystem.”
The goal of the FKCCS, excerpted from FAC Rule 28-20.100, reads as follows:
“The carrying capacity analysis shall be designed to determine the ability of the Florida Keys ecosystem, and the various segments thereof, to withstand all impacts of additional land development activities.”
The CCIAM is a spatially explicit, GIS-based, automated model that evaluates the end-state effects of additional land development activities on the Florida Keys ecosystem, including impacts on socio-economics, human infrastructure, and social preferences. Land development activities modify land use patterns, including the type, location, intensity, and distribution of land uses. The CCIAM analysis is triggered by changes in land use; the user can define alternative scenarios by modifying land use patterns and specifying stormwater and wastewater treatment type. The model recognizes three types of development actions: new development, redevelopment, and restoration. New development considers the conversion of undeveloped areas, whether disturbed or in a natural state, to a developed land use. Redevelopment either converts developed land from one type of use to another or changes the intensity of the land use. Restoration reverts developed land to a “natural” or restored habitat.
Map 2.1 Keys Region
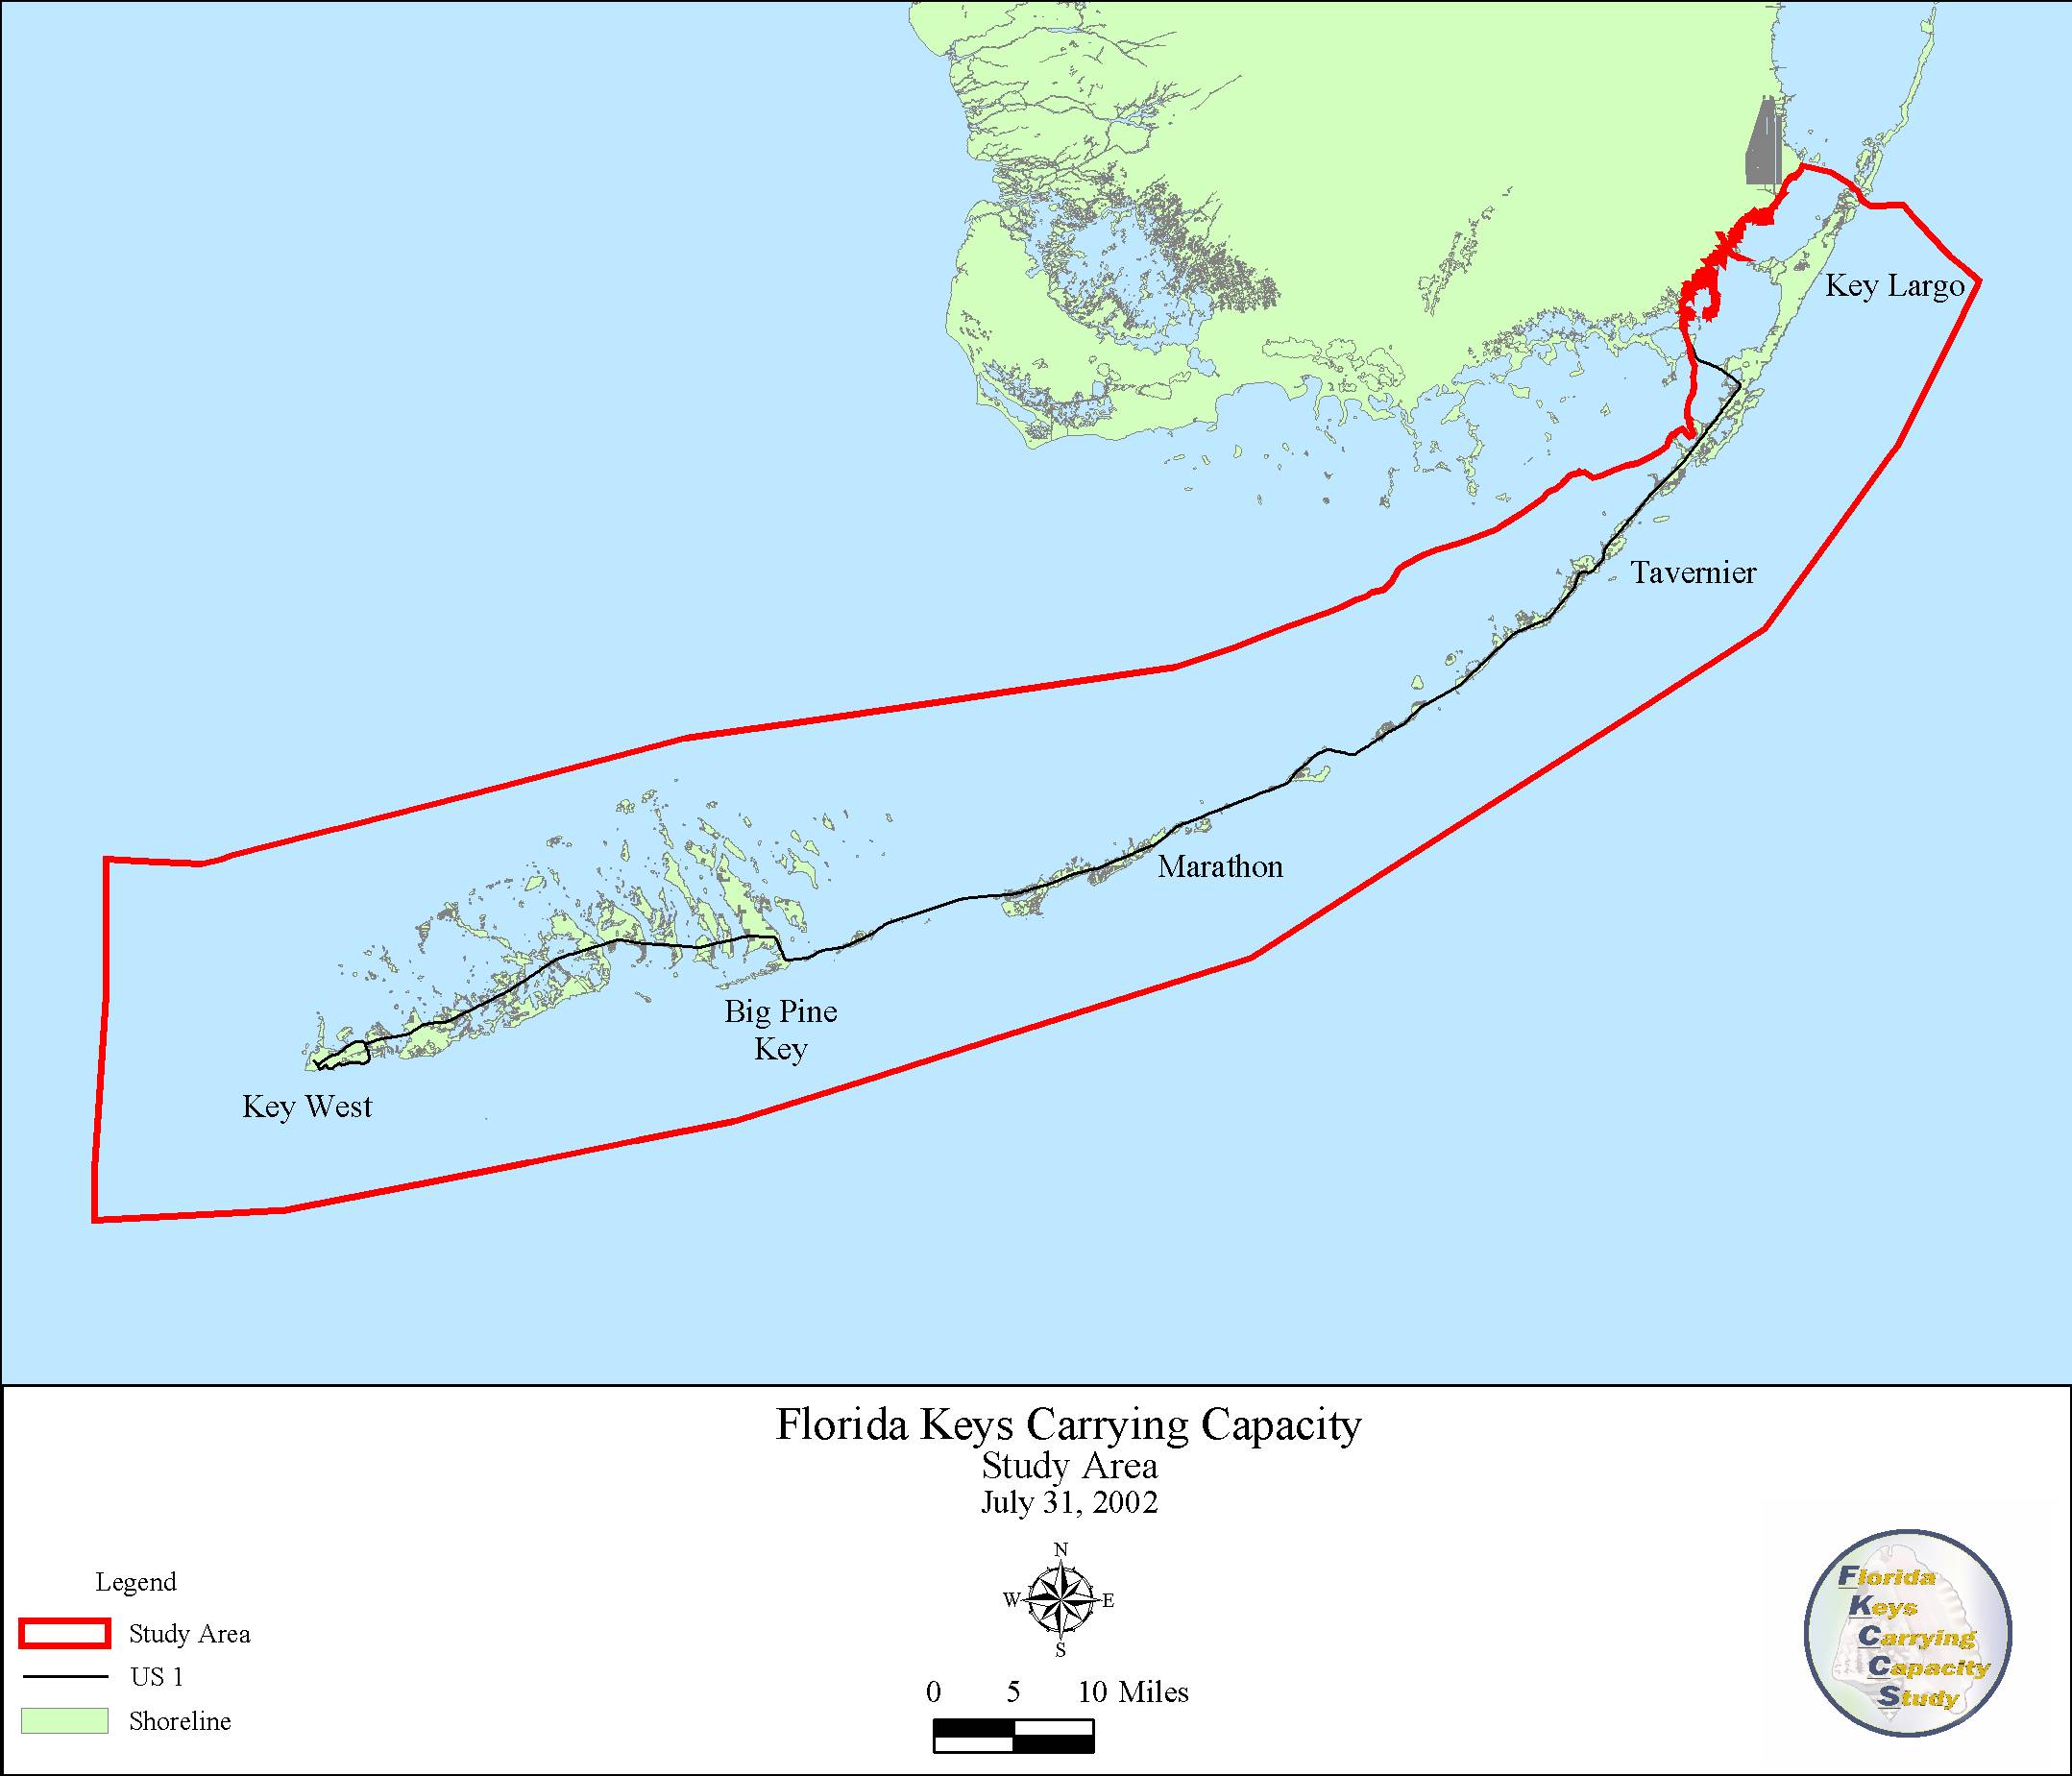
View maps of the Upper Keys, Middle Keys and the Lower Keys.
3.0 Scenario Description
The following information itemizes the options selected to define the scenario. Generally, the CCIAM analyzes the impacts of alternative land uses on the ecological, social, and infrastructure systems in the Florida Keys. In some instances, the CCIAM may only analyze the change in best management practices or the retrofitting of infrastructure. The reader is encouraged to review the selections made for this scenario prior to interpreting the results from the CCIAM.
Table 3.1 provides information regarding the requestor and modeler who executed the CCIAM analysis for this scenario. All questions regarding the scenario definition should be directed towards these individuals.
Table 3.1 Administrative Information
Please click on the links below to view detailed information about the changes selected for each planning unit.
| Cross Key (Paed 22) | Key Colony Beach |
| North Key Largo (Paed 21) | Bahia Honda Key |
| Ocean Reef Club | Big Pine Key |
| Garden Cove (Paed 19 and 20) | Little Torch Key |
| John Pennecamp State Park (Paed 18) | Ramrod Key |
| Rock Harbour (Paed 17) | Big/Mid Torch Key |
| Rodriguez Key (Paed 16) | Summerland Key |
| Tavernier (Paed 15) | Cudjoe Key |
| Plantation Key | Upper Sugarloaf |
| Windley Key | Lower Sugarloaf |
| Upper Matecumbe | Bay Point |
| Lower Matecumbe | Boca Chica |
| Long Key / Layton | Stock Island |
| Marathon Primary | Key West |
4.0 Land Use Summary
A new land use map is usually created in each scenario. The location, extent, and magnitude of the land use types are used to assess impacts in the Florida Keys. For retrofitting scenarios, no new land use map is generated by the CCIAM. The following table and series of maps should be reviewed to gain and understanding of the distribution and relative proportion of land uses resulting from the scenario.
Table 4.1 Land Use Summary
Table 4.2 Land Use Acreage
5.0 Carrying Capacity Indicators
Eleven measures are assessed in the CCIAM to indicate the impact of each scenario on the ecological, social, and infrastructure systems of the Florida Keys. Each indicator has an associated threshold that is documented in scientific literature, required by a government rule, or has been identified as a threshold indicating a decline in quality of life. Together, the carrying capacity indicators provide a framework to explore carrying capacity issues in the Florida Keys. Note that the CCIAM analyzes and produces a wealth of additional information for each scenario. Only the carrying capacity indicators and selected additional indicators are reported in this document. For a complete listing of information produced by the CCIAM, please see the Model Output Listing on the accompanying CD-ROM.
Table 5.1 Carrying Capacity Indicators
| Indicators | Definition | Scenario_Values | Comments |
| Population demand for non-residential uses | Demand is higher than the available non-residential uses | View Table | Population demand for retail, services and other non-residential uses, increases development demand. The user may input further development in the scenario and run model again. |
| Business demand for employees | Demand is higher than the available local labor force | View Table | If the business demand for employees surpasses the available local labor force, pressure builds to increase commuting employees. |
| Per capita government expenditures | Increase in the per capita expenditures as a result of the scenario | View Table | An increase in per capita government expenditures means that the government will have to seek increased revenues to match increased expenditures. Therefore, it indicates pressure to increase taxes. |
| Level of Service of U.S. 1 | Median speed. U.S. 1 wide, the threshold speed of 45 mph. Required speed may be different for different segm | View Table | Current regulations require the Monroe County maintain an adequate LOS. A failure to maintain the required LOS results in a building moratorium. |
| Hurricane evacuation clearance time | The time required to evacuate the Keys in case of an impending hurricane. | View Table | Current regulations required that the Keys population evacuate in 24 hours. |
| Permitted volume of water supply | Daily
average: 15.83 MGD
Maximum day: 19.19 MGD |
View Table | Per South Florida Water Management District permit which expires December 2005. |
| Minimum patch size for upland Keys forests | 13 acres | View Table | Keys hammocks smaller than 5.9 ha. are considered all edge, with forest interiors lacking the buffering effects of edge vegetation (Strong and Bancroft 1994). |
| Lower Keys marsh rabbit habitat | Species is in danger of extinction | View Table | Species is currently in danger of extinction, mainly due to habitat loss (Forys and Humphrey 1994). Only habitat restoration would be beneficial for the Lower Keys marsh rabbit. |
| Key deer habitat | Habitat quality classification Tier 2 and 3 (Figure 9.3). | View Table | Recent studies (Lopez 2001) have determined habitat needs for Key deer. |
| Patch size requirement for forest- nesting birds in the Florida Keys | Minimum
patch size:
White Crowned Pigeon.Fledglings hatch in mangroves but require large (12 acres) hammock patches within 72 hours. Black-whiskered vireo: 0.5 acres;White-eyed vireo: 5 acres;Northern flickers: 7.5 acres;Yellow-billed cuckoo: 16 acres;Mangrove cuckoo 12.8 |
View Table | Documented in Bancroft et al. (1995), who studied 27 Upper Keys forests ranging in size from 0.5 to 217 acres. |
6.0 Additional Indicators
In addition to the carrying capacity indicators, other indicators are being reported within this document. While these indicators do not have known thresholds, they may be used in conjunction with the carrying capacity indicators to understand the scenario impacts to the Florida Keys. Each additional indicator is specific to a CCIAM module. The reader is advised to review the delivery orders pertaining to the CCIAM module and the final report to gain a full understanding of these measures.
6.1 Land Use
The scenario choices determine a new spatial pattern of land use, which triggers each of the modules’ impact evaluation. Therefore, land use change is the primary basis of the CCIAM. The following table displays the change in land use from the current conditions.
Table 6.1 a Land Use Change - Keys wide and Upper Keys
Table 6.1 b Land Use Change - Middle Keys and Lower Keys
6.2 Terrestrial
For each of the indicators described below, the percent change from current conditions is summarized keys wide and for each of the keys segments (upper, middle, lower). Please refer to the Model Output Listing for additional terrestria statistics.
Direct impacts occur when habitat is replaced with homes or non-residential development. This is one of the most recognizable ecological impacts of development on the terrestrial systems of the Florida Keys.
Table 6.2 a Direct Impact To Habitat - Keys wide and Upper Keys
Table 6.2 b Direct Impact To Habitat - Middle Keys and Lower Keys
In-direct impacts to habitat are defined as those impacts that do not physically remove habitat but, reduce its ecological value due to noise, predation from domestic cats, trash dumping, additional light, etc. The CCIAM calculates in-direct impacts from the edge of development out to five hundred feet from the developed areas.
Table 6.3 a In-direct Impacts To Habitat - Keys wide and Upper Keys
Table 6.3 b In-direct Impacts To Habitat - Middle Keys and Lower Keys
Table 6.4 a Direct Impacts To Uplands - Keys wide and Upper Keys
Table 6.4 b Direct Impacts To Uplands - Middle Keys and Lower Keys
Table 6.4 c In-direct Impacts To Uplands - Keys wide and Upper Keys
Table 6.4 d In-direct Impacts To Uplands - Middle Keys and Lower Keys
Direct impacts to the key deer, Schauss swallowtail butterfly, Key Largo woodrat, Lower Keys marsh rabbit, and silver rice rat are computed similarly to the direct impacts to habitat. Where development occurs, the habitat is converted to developed areas. In addition, risk from domestic cats is calculated for the lower keys marsh rabbit and silver rice rat.
Table 6.5 Impact To Species
Direct impacts to the following bird species is calculated in the same manner as the other direct impacts to terrestrial systems. The reader should be aware that there are documented minimum acreage thresholds for Black-whiskered vireos, White-eyed vireos, Northern flickers, Yellow-billed cuckoos, and Mangrove cuckoos. These thresholds are presented in Section 5, Table 5.1.
Table 6.6 a Direct Impacts to the White Crowned Pigeon and Forest Nesting Birds - Keys wide and Upper Keys
Table 6.6 b Direct Impacts to the White Crowned Pigeon and Forest Nesting Birds - Middle Keys and Lower Keys
6.3 Marine
The marine module consists of one component, the canal impacts component, that calculates the combined storm, waste, and groundwater loads being discharged into representative canals. These loads are modeled to produce a pollution concentration representative of canals throughout the Florida Keys. The reader is urged to review the Florida Keys Carrying Capacity Study final report to further understand the purpose and constraints of this component.
Table 6.7 Representative Pollutant Concentrations Discharged From Canals
6.4 Water
Pollutant loads are calculated for stormwater, wastewater, and groundwater. These loads are a reflection of the number of dwelling units, method of wastewater treatment, amount of developed acreage, and use of best management practices defined in the scenario. Additionally, potable water demand is calculated and compared with the permitted capacity of the Florida Keys Aquaduct Authority. The potable water results are reported in Table 5.1 as one of the carrying capacity indicators.
Table 6.8 Stormwater Loads
Table 6.9 Wastewater Loads
Table 6.10 Stormwater Surface Loads
Table 6.11 Stormwater Ground Loads
6.5 Socioeconomic
The socio economic module produces a variety of statistics that describe the human systems in the Florida Keys. Most of these results are provided in the accompanying Model Output Listing, are fully described in the Delivery Order 9 report, and the Florida Keys Carrying Capacity final report. However, the population demand, business demand, and population statistics are provided in this scenario report.
Table 6.12 Population
Table 6.13 Population Demand for Non Residential Uses
Table 6.14 Business Demand for Employees
6.6 Fiscal
The Fiscal Module of the CCIAM estimates the potential cost of user-defined development scenarios and the resulting impact on government expenditures. The primary indicators of a governmental entity’s fiscal condition are revenues, expenditures, operating position, debt structure, unfunded liabilities, and the condition of capital facilities, infrastructure, and community need. The module uses annual government expenditures per capita as the primary indicator of the fiscal impact of development. The essential underlying assumption for this approach is that local governments will set ad valorem tax millage rates at levels necessary to meet expenditures. Therefore, a scenario that results in a higher per capita government expenditure indicates pressure on government to increase revenue, including increasing taxes.
Table 6.15 Government Expenditure by different organizations
Table 6.16 Government Expenditures Per Capita by Plan Unit
6.7 Infrastructure
The CCIAM computes the level of service for US1 and hurricane evacuation time resulting from land uses defined in the scenario. Both the level of service and time for hurricane evacuation are reported as carrying capacity indicators in Table 5.1.
Table 6.17 Level of Service on US1
Table 6.18 Hurricane Evacuation